2. Equity Markets
Focus on favourable valuations
Dr. David-Michael Lincke, Head of Portfolio Management
In brief
- Over the past year, following the US Federal Reserve's change of course, the equity markets have focused solely on a global easing of monetary policy, whereby the signs of a progressive cooling of the global economy and declining corporate profits were deliberately ignored.
- In fact, the development of the global equity market over the course of the year can almost entirely be attributed to the development of the liquidity provided by the central banks.
- Cautious growth prospects for the global economy and the lack of a fundamental underpinning of the bull market are cautionary reminders for the coming year. Both the European and American equity markets slipped into a corporate earnings recession this year; the profit expectations for 2020 appear overambitious, especially for the American equity market.
- Distinct valuation divergences between regions, countries and sectors call for selectivity from investors but also open up opportunities. In addition to emerging markets, the medium- and long-term return prospects are attractive for parts of Europe. Energy and European banks stand out as attractive sectors, while technology stocks are likely to have exhausted their potential.
- The US equity market is threatening to become the victim of its own success: its high outperformance compared with the rest of the world comes with the downside of excessive valuations, which cause us to keep our distance.
Outlook
With astonishing carelessness and spurred on by the central bank’s reopened money taps, global equity markets have climbed to new highs. Next year, however, the climate is likely to become tougher. Even optimistic scenarios for the global economic outlook postulate a modest recovery in growth at best. It is doubtful that this will enable the earnings growth hoped for next year and validate the runaway prices in view of the clear current recession in corporate profits. Investors are therefore advised to be selective and to focus on favourable valuations. At the country and regional level, this is particularly true of emerging markets, but Japan and individual markets on the European periphery are also luring customers with bargains. US equities, on the other hand, should be avoided. Not only are they extremely expensive to value, but the high weight of the technology sector also increases the risk.
Comment
Equity Markets in a liquidity frenzy
Over the past year, following the Federal Reserve's change of course, equity markets have focused solely on the prospect of a global easing of monetary policy. As a result, not only were the losses of the previous year made up again, but new highs were even reached in some cases. The signs of a progressive cooling of the global economy and declining corporate profits were deliberately ignored here. Only the headline-grabbing ups and downs of the trade dispute between the United States and China could temporarily dampen the risk appetite, but not for long. This is particularity astonishing when you consider that the economic impact of tariff-related distortions on world trade is fading in the face of the general slowdown in the global economy, which is being driven in particular by China.
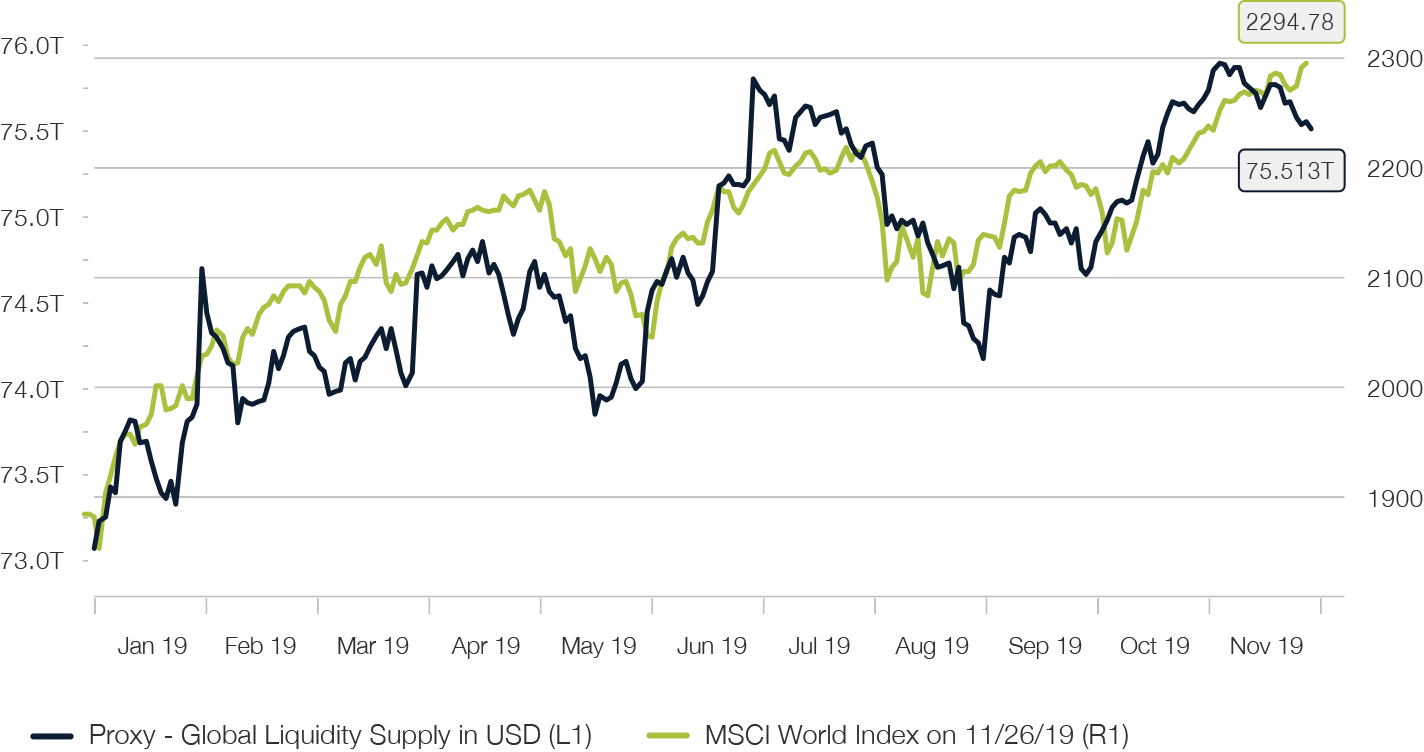
In fact, in quantitative terms, the development of the global equity market measured by the MSCI World DM benchmark over the course of the year can also almost entirely be attributed to the development of the liquidity provided by the central banks (see Fig. 12).
Fig. 12
Global equity markets under the spell of central bank liquidity
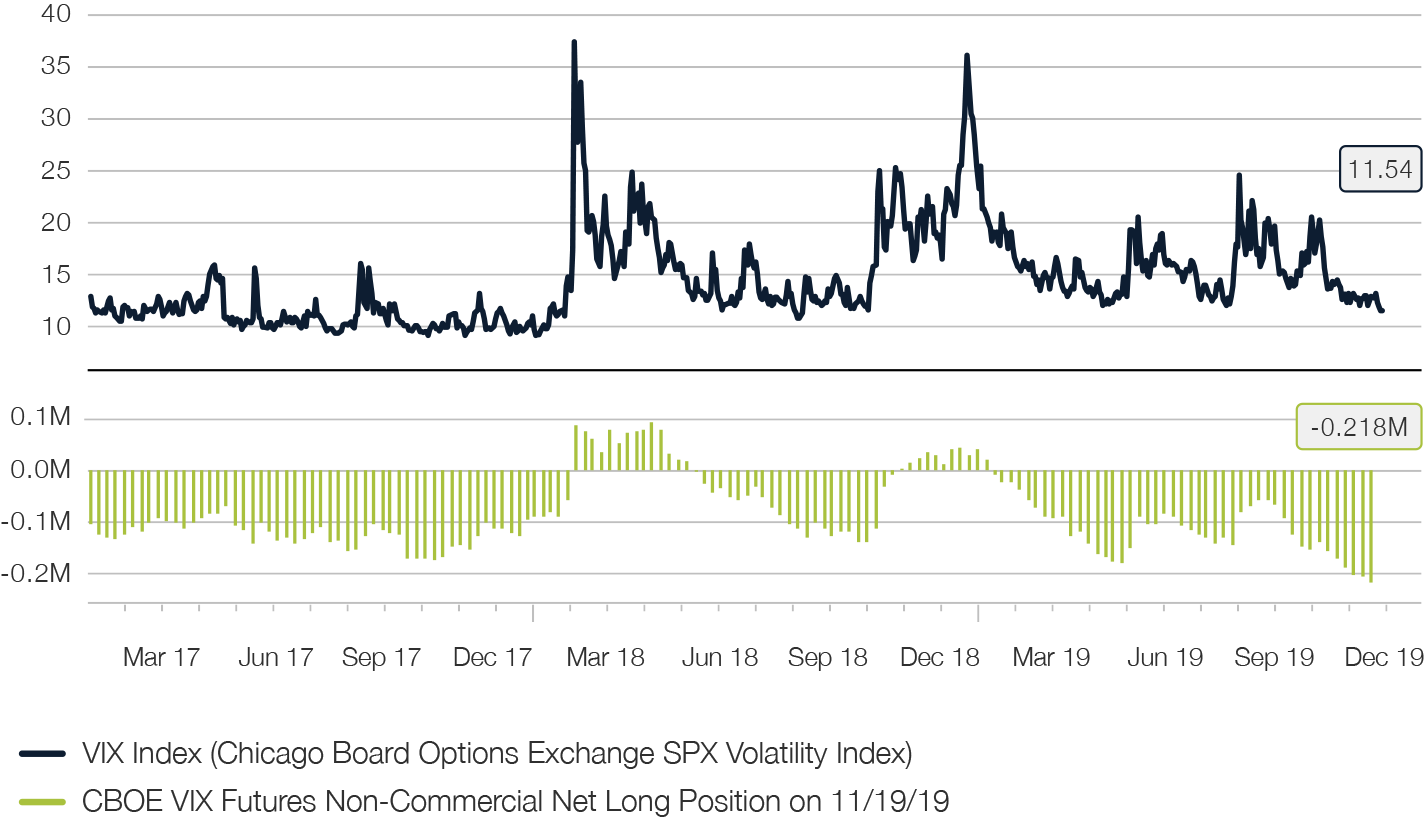
As in previous market phases, which were dominated by monetary policy activities, this is reflected in an increasing dampening of achieved and realised equity market volatility. Hence the VIX Index, a barometer of the short-term implied volatilities of options on the broad American S&P 500 benchmark, is again approaching the single-digit range, which has not been reached since 2017. This is accompanied by an increasingly one-sided positioning of speculative market participants in the corresponding futures. These investors’ bets on further declining volatility (net short position) have already reached a new record level beyond the extreme values of 2017 (see 3). As a result, a crash on the volatility market occurred at the beginning of 2018, marking a medium-term top on the global equity markets. Once again, there is a high probability that the resolution of this imbalance will have a corrective effect on the equity markets.
Fig. 13
Implicit share volatility in free fall
However, it is not just internal equity market fundamental and technical factors that draw scepticism about the sustainability of the current bull market. The global macro environment and in particular the ongoing slowdown of the Chinese economy are also providing warning signals (see also the chapter “Macroeconomic Trends, Bonds and Currencies”). Over the past decade, the rest of the world’s increasing dependence on the fate of China has resulted in a high correlation between the rolling returns of the global MSCI World DM benchmark and the intensity of credit expansion in China (see Fig. 14). The Chinese credit impulse has developed into a leading indicator for the equity market with a lead time of around five months.
Fig. 14
Close link between global equity market and Chinese credit expansion: Rolling twelve-month return of the MSCI World DM Index vs. Credit impulse of the Chinese economy with five months lead time
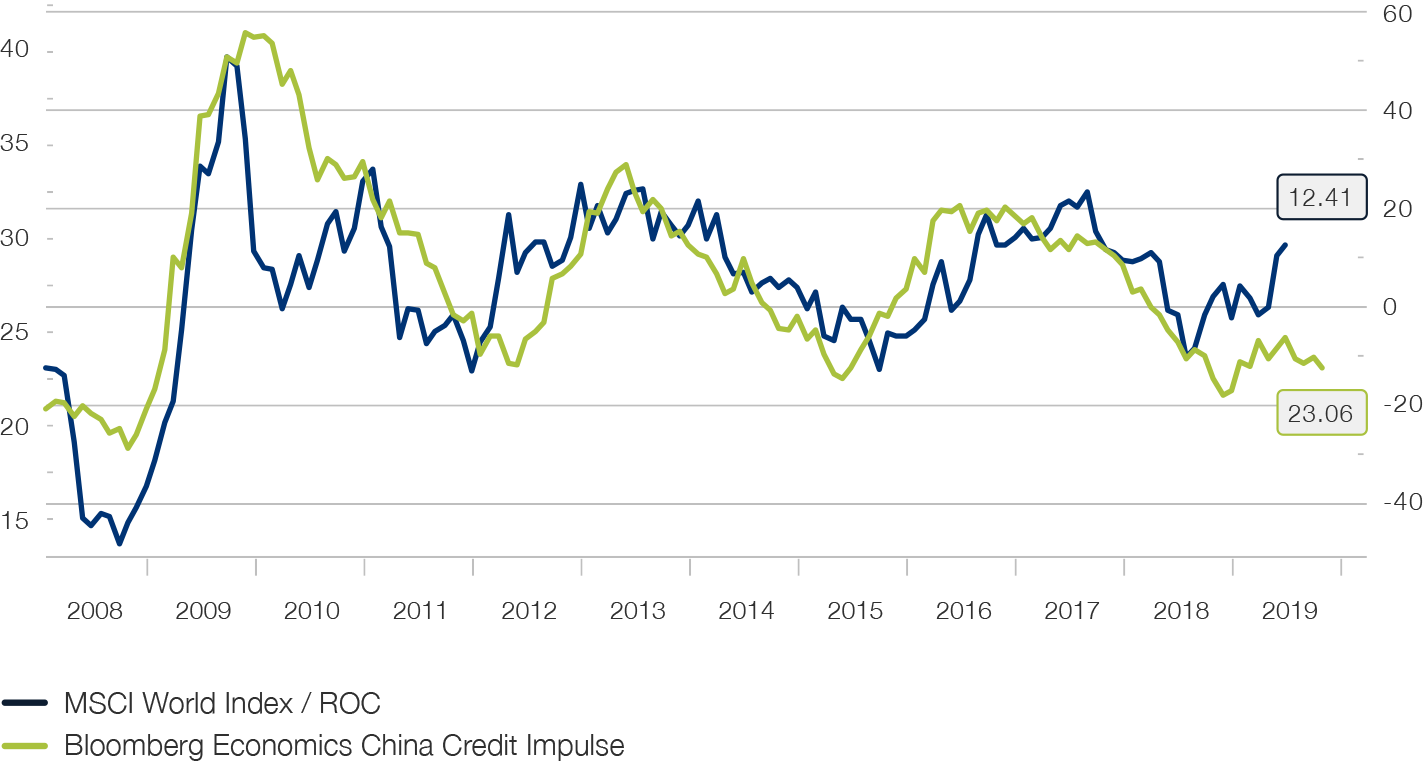
The limited impact that the current Chinese stimulus measures have had thus far and the reluctance or lack of room for manoeuvre on the part of the People's Bank of China and the government to do substantially more suggest that the current divergence will close downwards.
It is striking how clearly the equity markets of the emerging countries have been lagging behind most of the developed equity markets over the past year (see Fig. 15). The emerging economies are much more exposed to the dynamics of world trade. It is therefore not surprising that, against the backdrop of a reduction in expectations and repeated delays regarding the reaching an agreement between China and the United States, this underperformance has continued to accentuate in the second half of the year.
Fig. 15
Development of selected equity markets in 2019
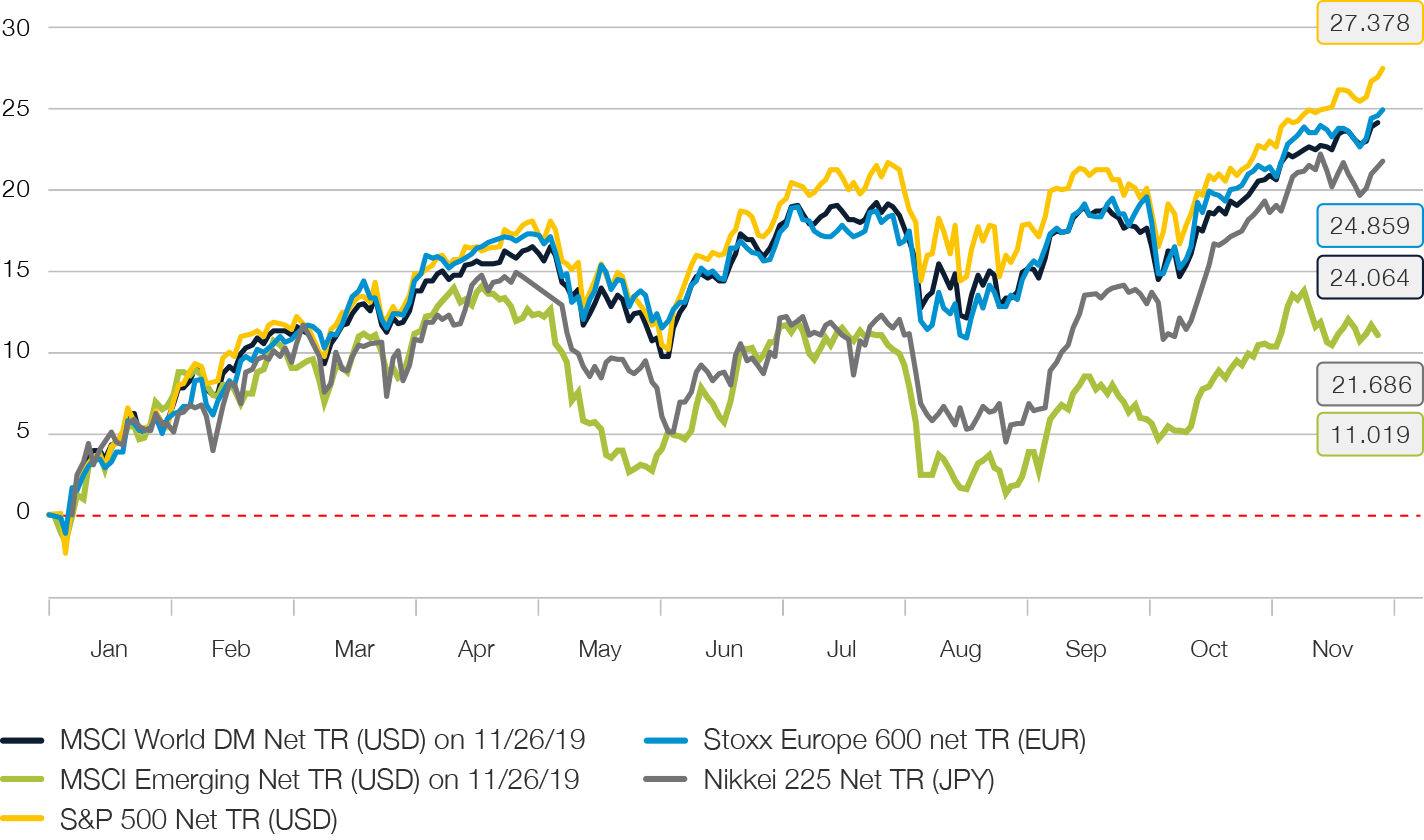
Source: Bloomberg LP, 29. November 2019
However, given the sustained higher growth rates in these parts of the world, it is surprising that the emerging markets have been experiencing a relative weakness in performance for almost ten years. Emerging market equities have now lost all the outperformance they gained against the developed equity markets since 2005. Conversely, this has also accentuated the valuation advantage for companies in these regions, which raises medium- and longer-term return expectations significantly above the OECD average.
Uncertain earnings prospects for companies and pronounced valuation divergences require selectivity on the part of investors
Both the European and American equity markets slipped into a corporate earnings recession over the past year. In the first three quarters, profits fell below the previous year's level, particularly in the third quarter with reductions of almost 5% in Europe and 3% in the United States. For the fourth quarter as well, consensus estimates assume that earnings will continue to fall.
However, a strong recovery is expected for the coming year. According to the consensus forecast, corporate profits in the United States, Europe, Switzerland and Japan are expected to rise by 8% to 9% in 2020. However, the modest economic outlook raises doubts about this optimism.
By contrast, the outlook for emerging market equities is improving again. The hoped-for trade ceasefire between the United States and China and the likelihood of further cuts in US interest rates should support growth in emerging markets. With an average of 4%, the emerging markets’ economies are likely to grow much more strongly in the coming period, with industrialised countries boosting their profits by 14%.
The emerging markets’ currencies have lost a lot of ground but are showing signs of bottoming out and are trading significantly below value. A substantial depreciation of the US dollar, which we expect for the coming year (see also the chapter “Macroeconomic trends, bonds and currencies”), will help not only EM currencies but also corporate earnings growth.
This is compounded by the growth-enhancing effect of an increase in capital inflows into emerging markets and the fact that many investors are still cautious about the outlook for emerging market economies. In our view, this should be seen as a counter-indicator that suggests upward potential.
Taking a valuation yardstick such as the cyclically-adjusted price-to-earnings ratio (commonly referred to as the Shiller P/E ratio) as a basis – which has proven its worth with regard to its forecasting power over longer time horizons – a picture emerges of an unusually high spread in valuations, not only between industrialised and emerging countries but also within the block of OECD countries.
It is hardly surprising that the equity markets of many emerging countries appear attractive below this level. However, individual industrialised countries are also still clearly undervalued.
Japan remains our favourite industrialised country. Even though the economy is suffering from a slowdown of exports, equity valuations not only remain attractive on a relative basis, but also on an absolute basis. Of all the industrialised countries, Japanese equities are valued by most favourably by far. The low indebtedness of Japanese companies is another argument: On average, the ratio of net indebtedness to EBITDA is below 1.5%, which is lower than in the other industrialised countries. In addition, the Japanese central bank continues to pursue an extremely loose monetary policy.
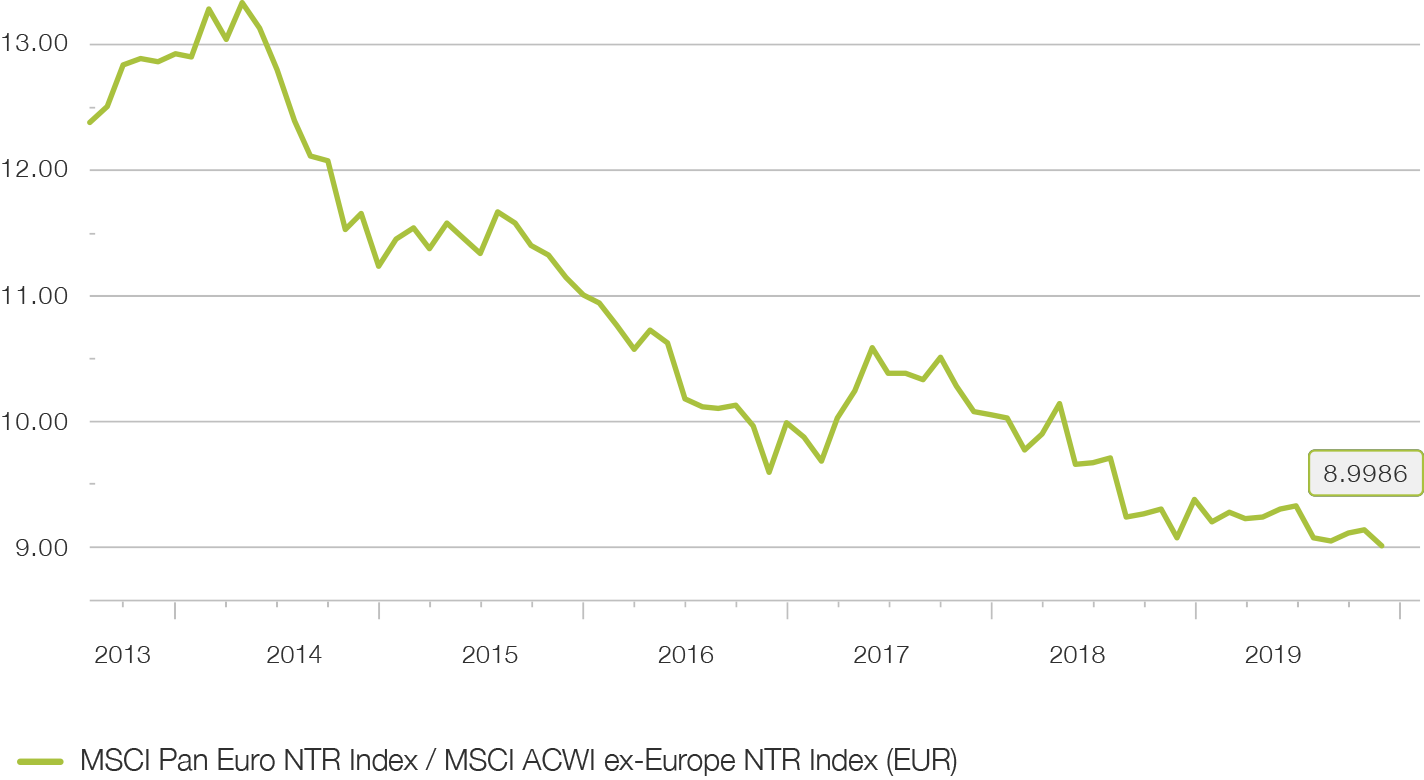
Individual European markets also appear attractive from a valuation perspective. In view of the pessimism that Europe is showing on the financial markets, this is not surprising. However, reservations on the part of investors are understandable given European equities’ years of sustained underperformance compared with the rest of the world (see Fig. 16), underpinned by largely stagnating corporate earnings.
Fig. 16
Long-term underperformance of European equities compared with the rest of the world.
In view of its export orientation, a lack of momentum has increasingly turned the European equity market into a representative tool for the condition of the emerging economies. If demand accelerates in the emerging markets, companies will benefit, but this decline will be due to a lack of impetus in view of the structural growth weakness in the European domestic market.
Improved prospects for the emerging markets in the coming year could therefore also promise good things for Europe, even if the domestic economy is paralysed and the scope for monetary policy has been largely exhausted (despite assurances to the contrary by ECB representatives).
Particularly low valuations can be found in the countries on the periphery of Europe that have been shaken by the debt crisis, where, alongside Spain, Italy stands out above all. The Swiss equity market, on the other hand, is one of the most expensive in the world; however, in view of its defensive qualities, it should be able to hold its own in the coming year under the scenario of a weak economic environment and perform better than the European average.
At sector level, prospects are opening up for energy stocks and European banks, while technology stocks appear overpriced
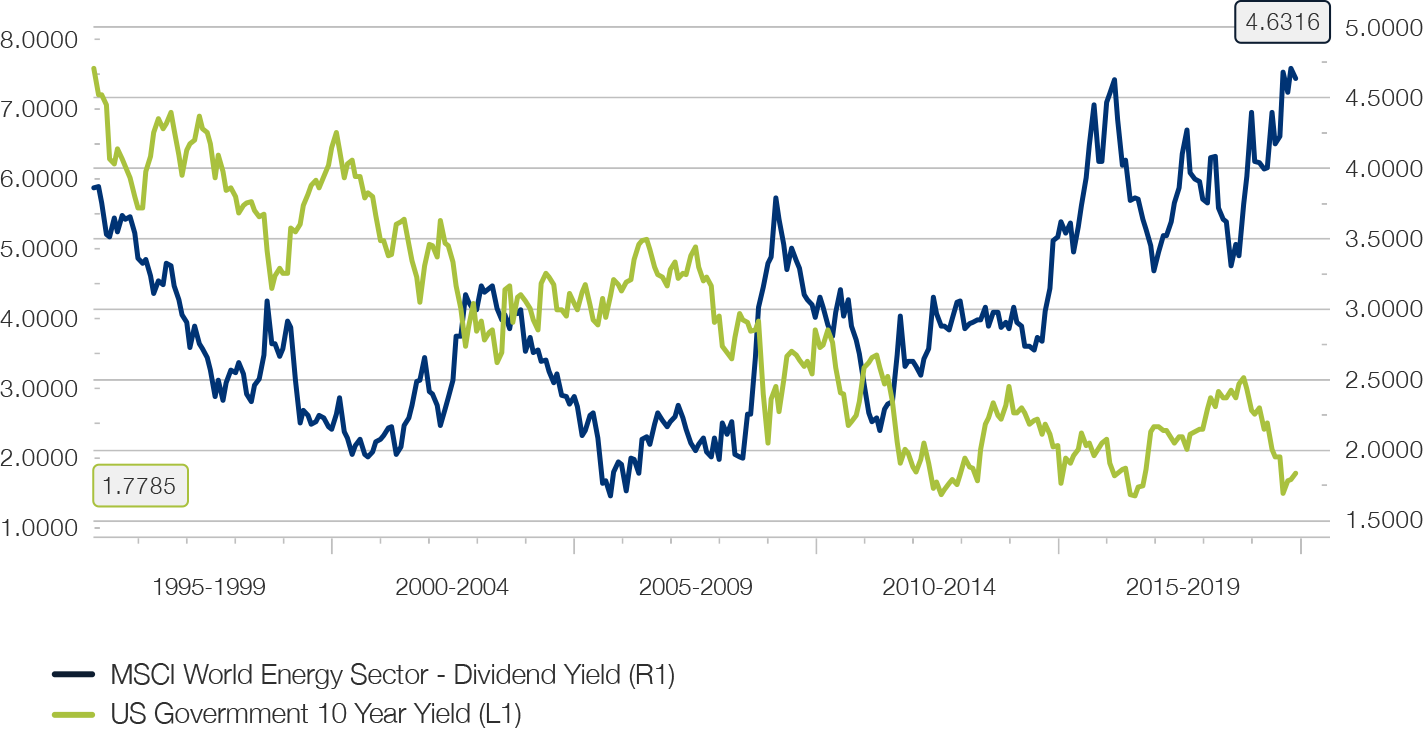
Commodity-related equities, including energy stocks in particular, turned out to be one of the sectors with the weakest development over the past year. Against this backdrop, the sector's dividend return has risen to nearly 5%, the highest in more than twenty years and well above the return on ten-year US Treasury bonds (see Figure 17).
Fig. 17
Attractive dividend return for energy stocks of almost 5% on average
From a valuation perspective, too, there are a number of arguments in favour of energy companies. Many stocks are quoted below the replacement value of their reserves, a situation last witnessed at the end of the previous decade in the wake of the global financial crisis.
Most European banks are valued even lower and only traded at a fraction of their book value (see Fig. 18). The recovery of the broad equity market over the past year has been largely overlooked. In contrast to the US banking system, regulators in Europe failed to implement rigorous recapitalisations in the aftermath of the financial crisis ten years ago, and to wind up institutions that were not viable in the long term or to merge then with stronger partners. The result is a structural weakness in earnings, which is reflected in an exorbitant valuation discount to American banks (see Fig. 18). This was put to bed for the time being in 2018; nevertheless, at the beginning of this year we warned against following the siren call of low valuations and to stay away.
Fig. 18
Massive valuation discount of European versus American banks shows signs of stabilization
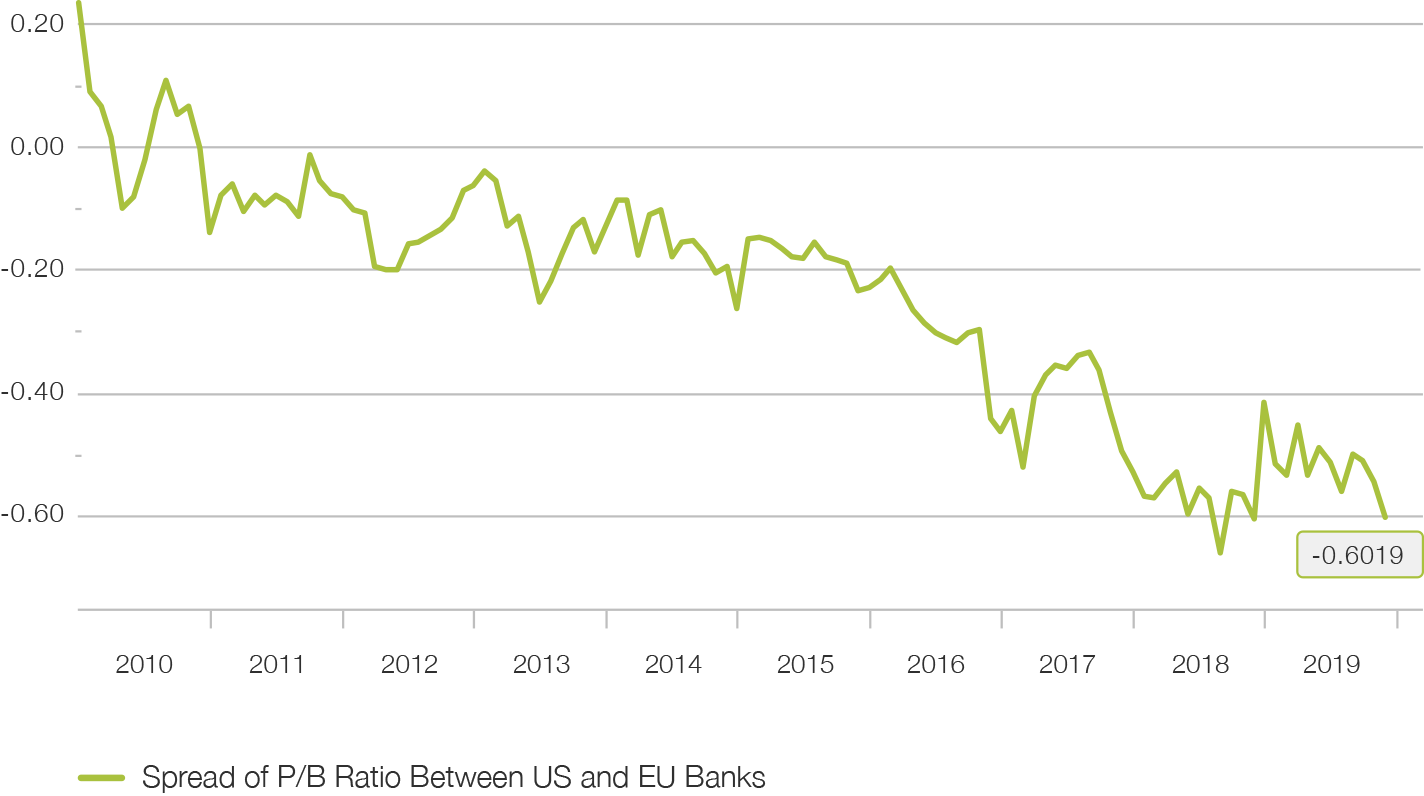
In the meantime, however, the valuation of the banking sector relative to the overall market has reached extreme values, which has been followed in the past each time by a phase of significant outperformance. Thus, the book value discount is now more than two standard deviations below the book value of the overall market, while the dividend yield of the banks exceeds that of the overall market by two standard deviations.
The ECB is also making efforts to take account of the banks' lack of profitability through relaxations of and derogations to its negative interest rate regime. In addition, two of investors' biggest concerns have evaporated over the past year: the budget conflict with Brussels, which was a burden on the Italian bond market, has been resolved and the ECB has resumed its quantitative easing programme.
In contrast, the prices of defensive stocks such as utilities, pharmaceuticals and consumer staples, which are currently very attractive to investors in view of the shaky economic outlook, are already reflecting respectable premiums.
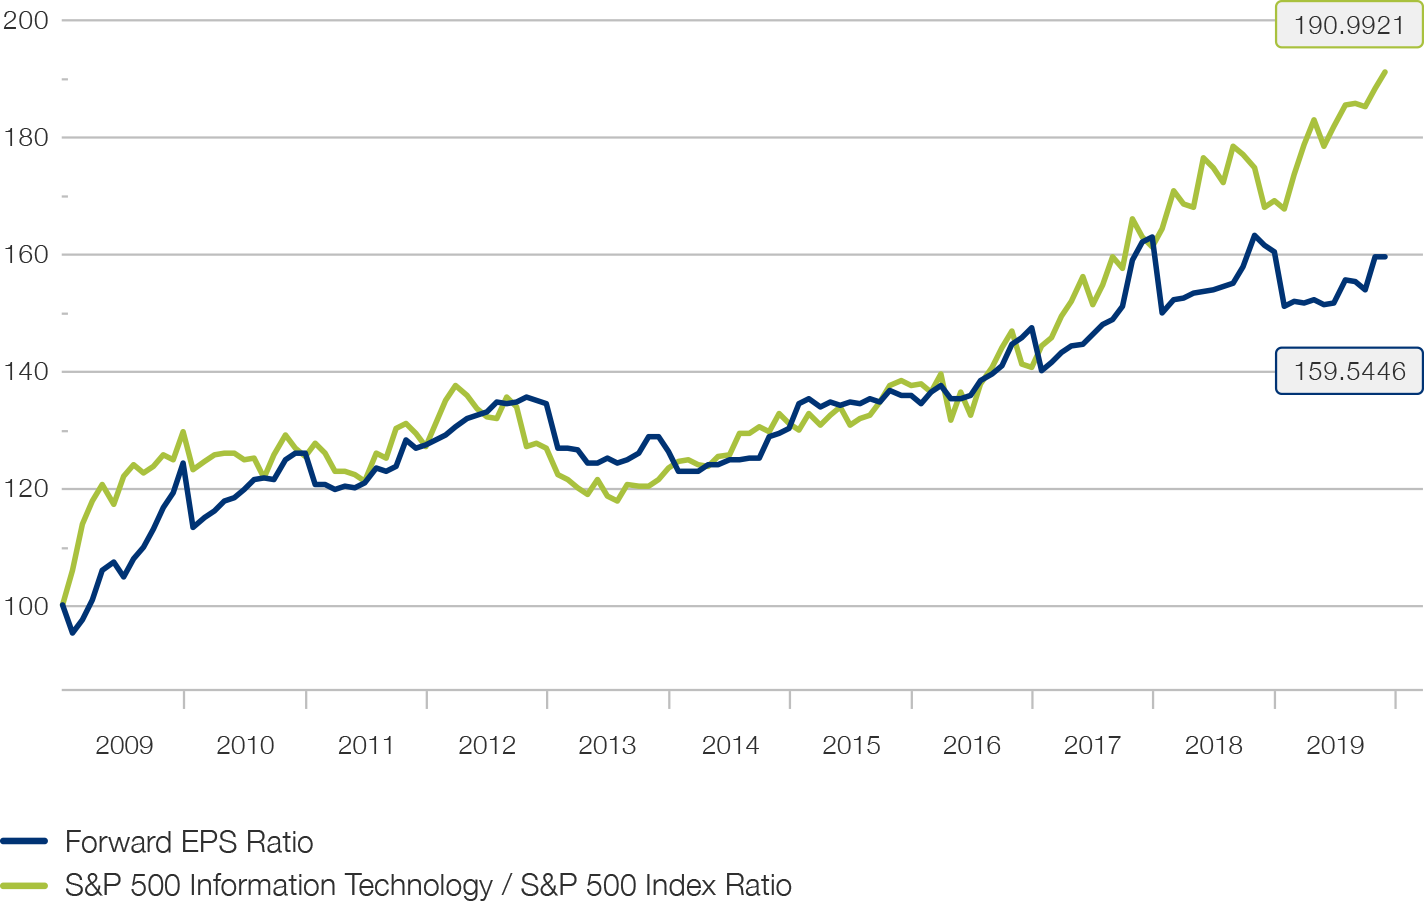
The prospects for technology stocks are also unattractive. In the past year, they again followed the pattern of previous years and clearly outperformed the broad equity market with their price gains. However, this outperformance has not been underpinned by correspondingly stronger profitability since 2018 (see Fig. 19).
Fig. 19
The outperformance of technology stocks lacks the support of a relatively higher growth in corporate earnings
But this is not the only reason why the technology sector is likely start running out or air next year. Twenty years after the internet bubble, the sector has once again become a driving force, especially in the US equity market. Their share of market capitalisation now stands at over 25%, a level that was only crossed once before for a short time at the turn of the century, before the speculative bubble burst. The broad equities market’s dependence on the fate of the technology sector is therefore currently higher than ever before.
Until now, investors have ignored the potential risks that the trade war poses for technology stocks, which will likely come back to haunt them in the future. The fact that the US government has blacklisted Chinese companies such as Huawei is raising the spectre of a new technological Cold War and illustrates how susceptible companies in this sector are to sudden restrictions. Due to the close interdependence of the value chains, the consequences will be felt over time along the entire global value chain.
The risk that the technology sector poses for the broad equities market is by no means limited to a potential clouding of the course of business. The high sector concentration is in particular the result of the strong positive network effects that characterise many of the business models; the positive externalities promote a winner-takes-all dynamic whose natural end result is the establishment of monopolies. Although the interpretation of antitrust law in the United States has become much more cautious since the Reagan era, the fact that the reach of advertising and social media platforms has now entered the political sphere and even influenced the outcome of elections has provoked a potentially far-reaching political reaction. Even if the destruction of monopolistic structures were to be halted, the mere introduction and enforcement of more stringent regulation to protect private data sovereignty and privacy could severely affect the business models of the technology giants. The US Department of Justice's recent announcement of an antitrust investigation into Google's parent company Alphabet underscores the seriousness of this risk.
US stocks – high flyers with signs of fatigue
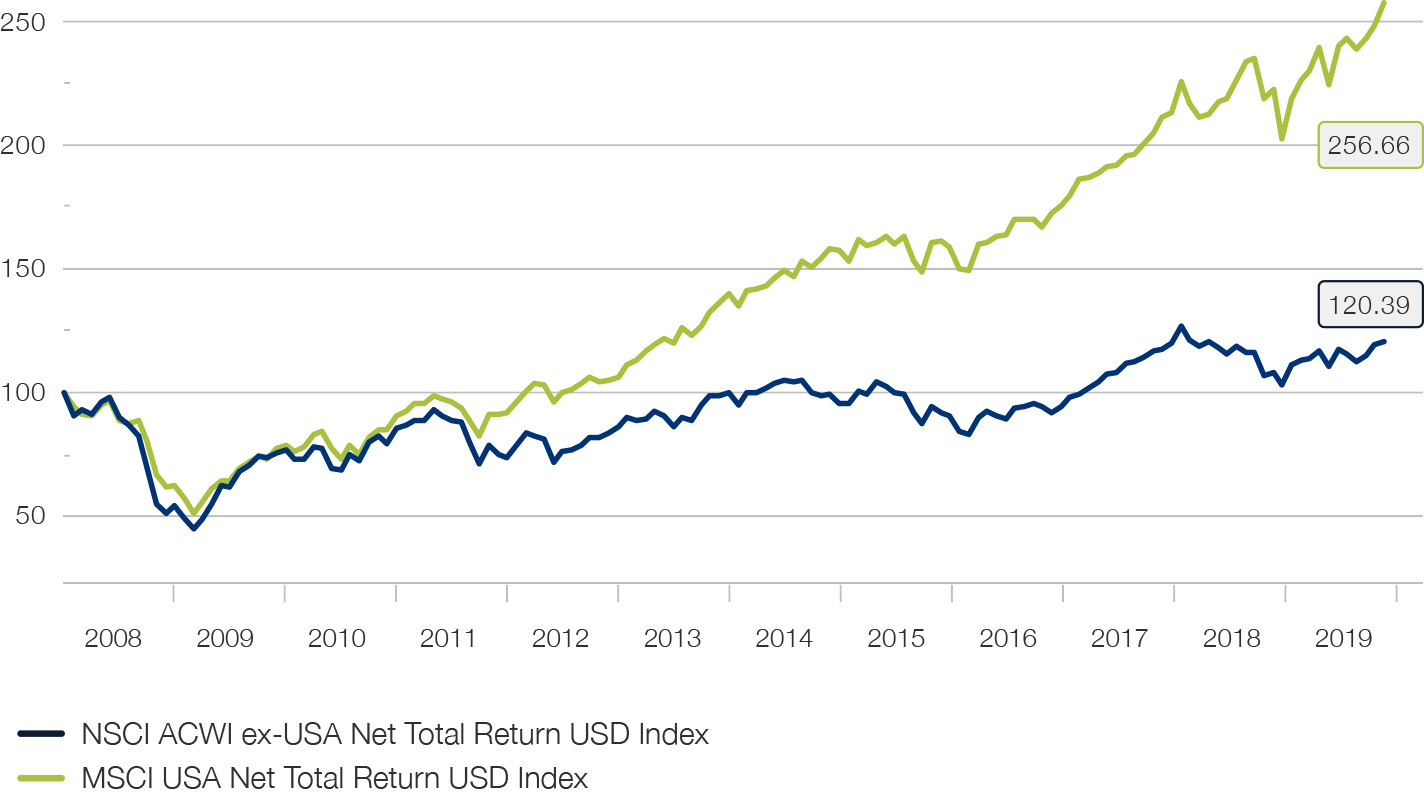
Nothing seems to stop the outperformance of the US equity market against the rest of the world. In the past year, it has once again outpaced the rest of the world, which, based on the MSCI ACWI ex-US Index, has been in a sideways consolidation for almost a decade (see Fig. 20).
Fig. 20
Practically no recovery for the rest of the world as US equities scale new heights
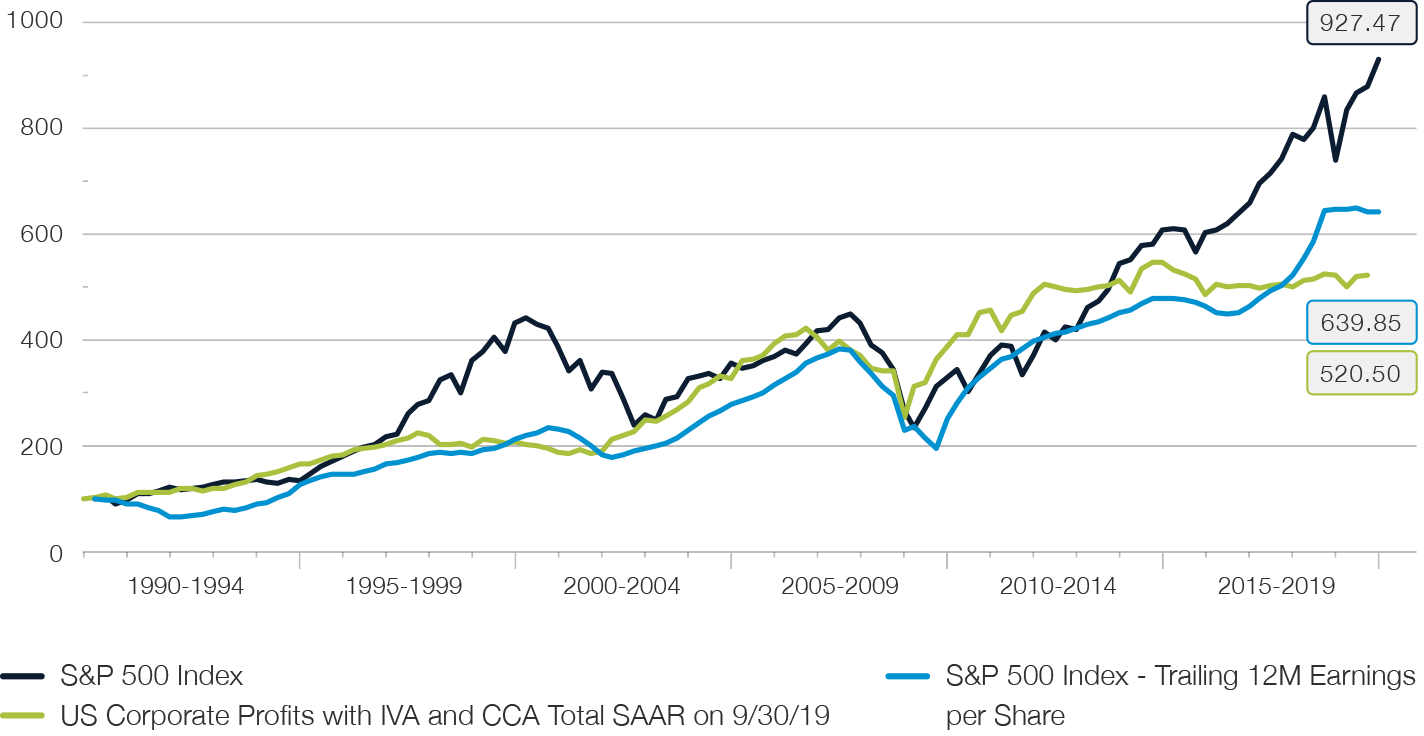
At the same time, however, the US market is becoming increasingly unattractive from a fundamental point of view. The development of fundamental data and corporate profits over the past few years has by no means kept pace with the share price. Around five years ago, there was already a decoupling of corporate profits from the National Income and Profit Accounts (NIPA profits) collected within the scope of national accounting for the entire national economy. Since then, they have exhibited no sustainable growth and have only developed sideways. However, the index also appears significantly overvalued compared to the accounting profits of the S&P 500 companies per share (see Fig. 21).
There are good reasons for temporary divergences between the two profit time series. Over the long term, however, both will find themselves again, with NIPA profit typically playing the role of a leading indicator with a lead time of around twelve months. The current divergence particularly reflects the fact that the source of much of the profit growth in recent years is due to financial engineering in the form of massive share buyback programs financed largely by the increasing leverage of corporate balance sheets. This significantly increased the reported earnings per outstanding share.
However, historical example shows that, sooner or later, phases of a strong drift between price and earnings performance of broad market indices will inevitably be followed by a renewed convergence between profits and prices. See, for example, the period from 1996 to 2003 marked by the internet bubble in Figure 21.
Fig. 21
US share prices outpace corporate profits
This also explains the persistently subdued-to-negative investor sentiment regarding equities, which is reflected in sustained outflows from equity funds despite new highs. In addition, the high level of equity sales by corporate insiders is anything but a sign of confidence in the attractiveness of the US equity market.
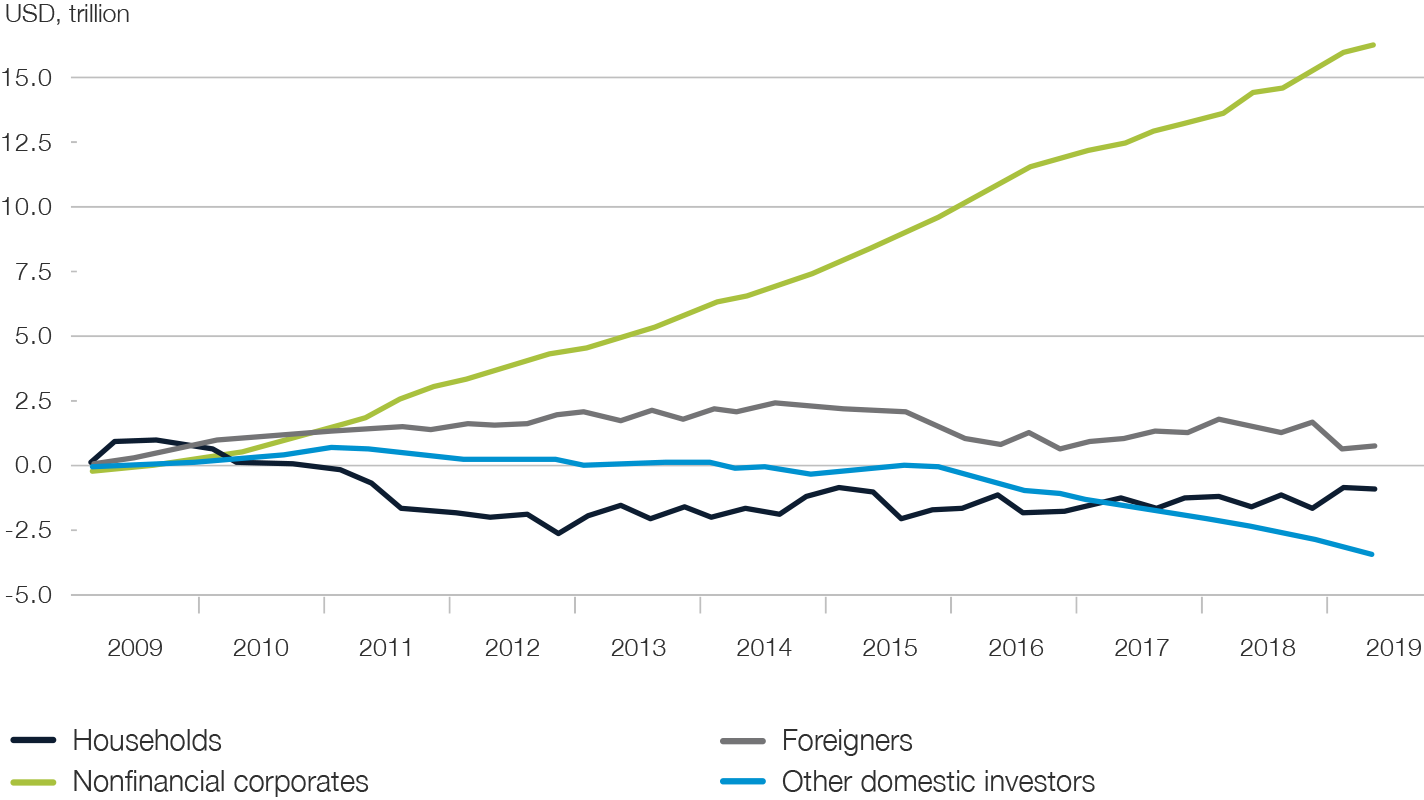
Companies themselves have jumped into the breach as buyers. Share buybacks fed by tax savings, repatriated capital and debt made favourable by continued eased financing conditions in the capital markets have set new volume records in the United States. A study by the Ned Davis Research postulates that without this support, the US equity market would be 20% lower than the S&P 500 index. A decomposition of the cumulative net purchases of American equities over the last decade even reaches the conclusion that, besides foreign investors to a small extent, the companies themselves were the only net buyers of American equities over the last decade.
If one considers its high valuation and its disproportionately strong focus on cyclical industries, the US market appears all the less attractive. With the exception of Japan, this cyclical orientation is more pronounced in the US than in any other major market, and it is more exposed than emerging markets to cyclical sectors for the first time in its history.
For the coming year, influence of the upcoming election campaign for the US presidency should certainly not be underestimated. While it is in the interest of current incumbent Trump to bring about as robust an economic picture as possible against this backdrop, the ideological character and political goals of various opponents on the Democratic side pose risks for the equity market. In particular, Senator Elizabeth Warren, who is cited with good chances of receiving the democratic nomination, could become an Achilles' heel for the equity market. Her political programme includes stricter regulation of banks, a break-up of monopolies in the technology sector and a ban on fracking technology for oil production.
With regard to portfolio positioning, this indicates a significant underweighting, if not elimination, of the exposure to US equities. The extent of the valuation divergences also makes currency-neutral, market-neutral long-short combinations appear attractive, especially with regard to Japan, the emerging markets and Europe.
Fig. 22
Cumulative net purchases of US equities over the last decade


Share Insight
Legal disclaimer
Picard Angst MEA Ltd. is a Private Company, established in Dubai International Financial Centre (‘‘DIFC’’) and regulated by the Dubai Financial Services Authority (‘‘DFSA’’). DFSA regulated firms are subject to Client Classification requirements and not all services and or products promoted may be suitable for Retail Clients under the DFSA rules and regulations. You are encouraged to seek independent financial advice as to your classification before entering into any transaction with the firm. This material is intended for use only by a Professional Client or Market Counterparty, as defined by the DFSA Client Classification requirements. This information is not intended for, should not be relied upon by, nor distributed to Retail Clients. Professional Clients may not be afforded the Retail Client protection and compensation rights that may generally be available to them from within the DFSA and other jurisdictions. For further information please contact: Picard Angst MEA Ltd., principal place of business: DIFC, Office No. 2008, Level 20, Emirates Financial Towers, South Tower, PO Box 506935, Dubai, United Arab Emirates.
Any opinions, projections, forecasts or estimates in this report reflect only current views of the author and are subject to change without notice. Picard Angst MEA Ltd. has no obligation to notify a reader or recipient of this publication in the event that any matter, opinion, projection, forecast or estimate contained herein, changes or subsequently becomes inaccurate, or if research is withdrawn.
The investments referred to in this publication do not take into account the recipients suitability requirements or investment risk appetite. Recipients are urged to base their investment decisions upon their own appropriate investigations that they deem necessary. In the event of any doubt about any investment, recipients should seek independent investment, legal and/or tax advice regarding the appropriateness of any transaction.
Any loss or other consequence arising from the use of the material contained in this publication shall be the sole and exclusive responsibility of the investor and Picard Angst MEA Ltd. accepts no liability for any such loss or consequence. Please note past performance is not necessarily a guide to the future performance of an investment.
Picard Angst MEA Ltd. aims to be transparent, fair in business dealings and to adhere to DFSA conflicts of interest requirements. For further information please contact the Dubai office.
© Picard Angst MEA Ltd.
Picard Angst MEA Limited
Emirates Financial Towers, South Tower, Office 2008, DIFC, Dubai, U.A.E. PO Box 506935
Telephone: +971 (0) 43785111. Email: info@picardangst.com, Web: www.picardangst.ae